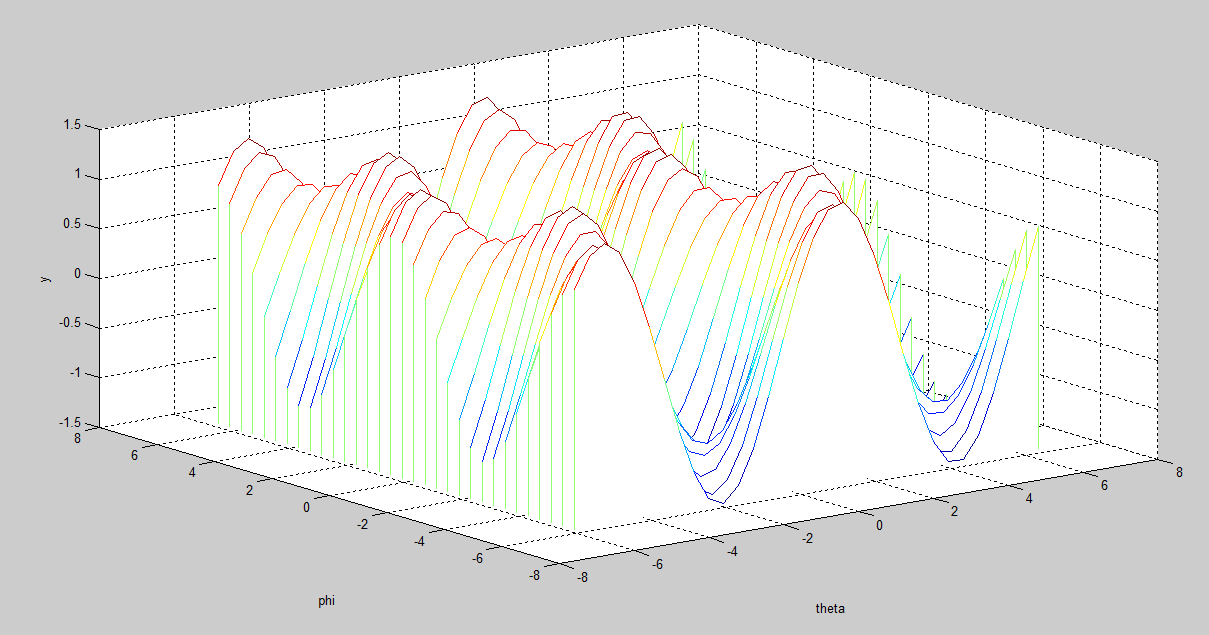
Matlab provides a number of functions that can be used to plot a function of 2 variables. Consider the following function.
y = sin(theta)+ cos(phi).*cos(theta)
here y is dependent on two variables theta and phi.
Now using 3D visualization tools in matlab the function will be plotted. This can be plotted in 3d graphics with matlab.. First define the grid on the xy plane as follows.
[theta, phi] = meshgrid(-2*pi:0.4:2*pi, -2*pi:0.4:2*pi);
Then define the function y,
y = sin(theta)+ cos(phi).*cos(theta);
Then use the various 3d plot functions as follows,
figure(1)
mesh(theta, phi, y)
xlabel(theta); ylabel(phi); zlabel(y)

figure(2)
surf(theta, phi, y)
xlabel(theta); ylabel(phi); zlabel(y)

figure(3)
surfc(theta, phi, y)
xlabel(theta); ylabel(phi); zlabel(y)

waterfall(theta, phi, y)
xlabel(theta); ylabel(phi); zlabel(y)

figure(5)
contour3(theta, phi, y)
xlabel(theta); ylabel(phi); zlabel(y)

figure(6)
contour(theta, phi, y, 15)
xlabel(theta); ylabel(phi); zlabel(y)

0 comments:
Post a Comment